Power BI for Finance Teams
We help finance teams build and improve Power BI solutions that automate reporting, improve data accuracy, and deliver clear, actionable insights.
Move from spreadsheet-driven processes to structured, reliable reporting — and give your team real-time visibility into financial performance.
Examples of Power BI in finance
Below are sample outputs from finance-focused Power BI work — automated reporting, executive dashboards, and drill-through views similar to what we design and implement for clients.
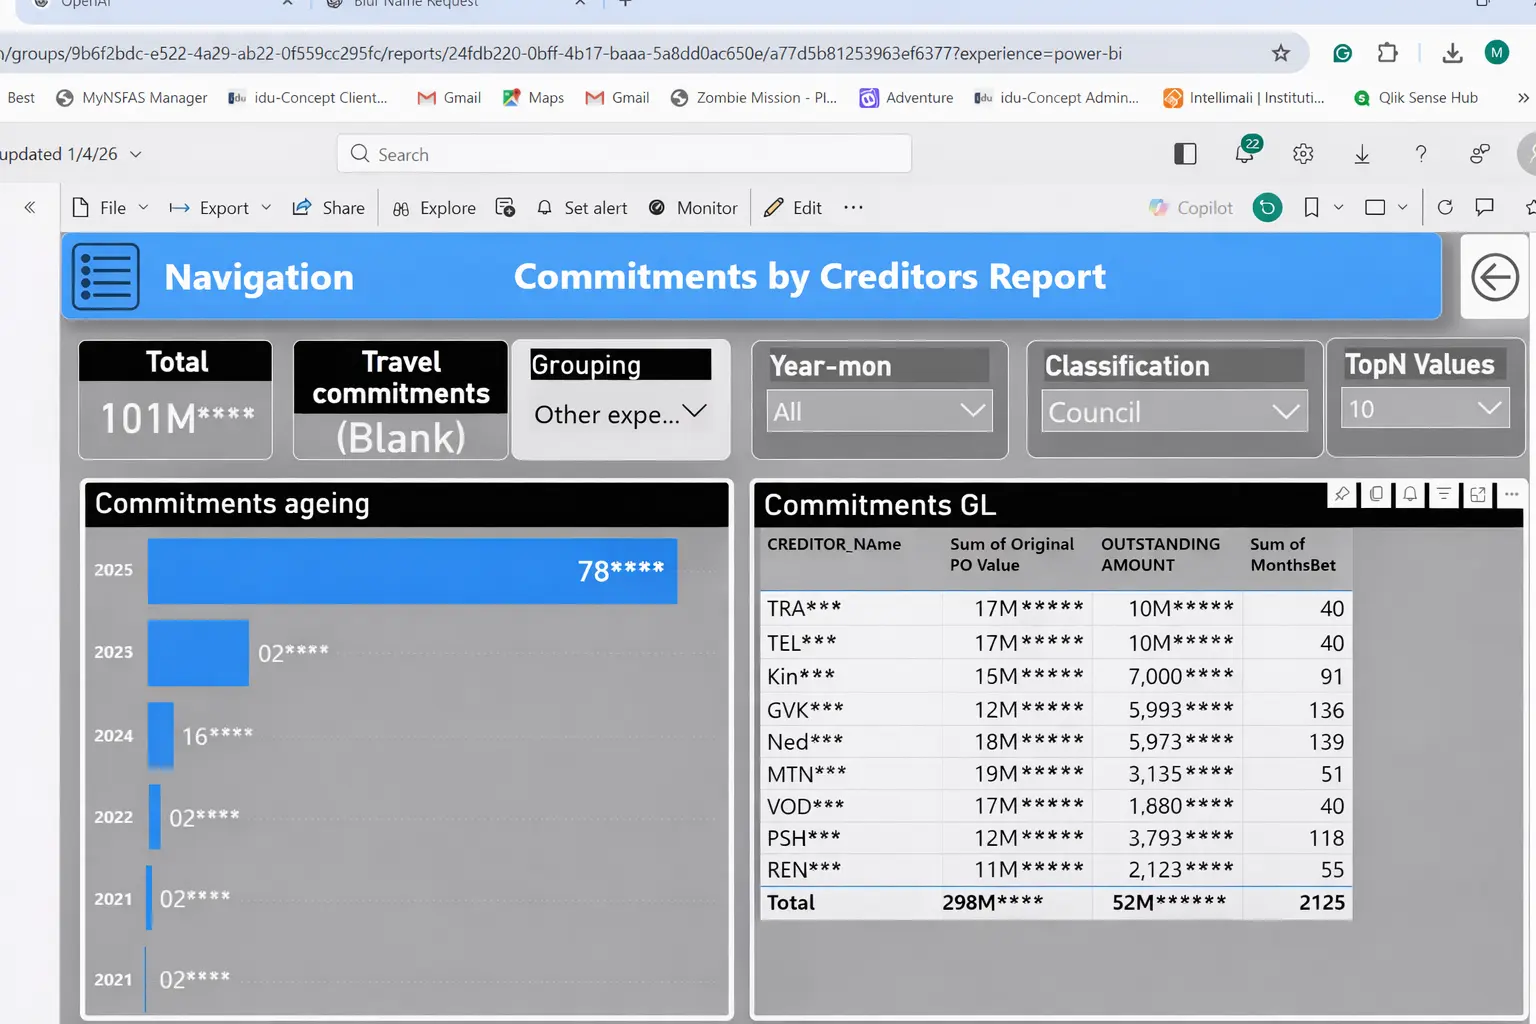
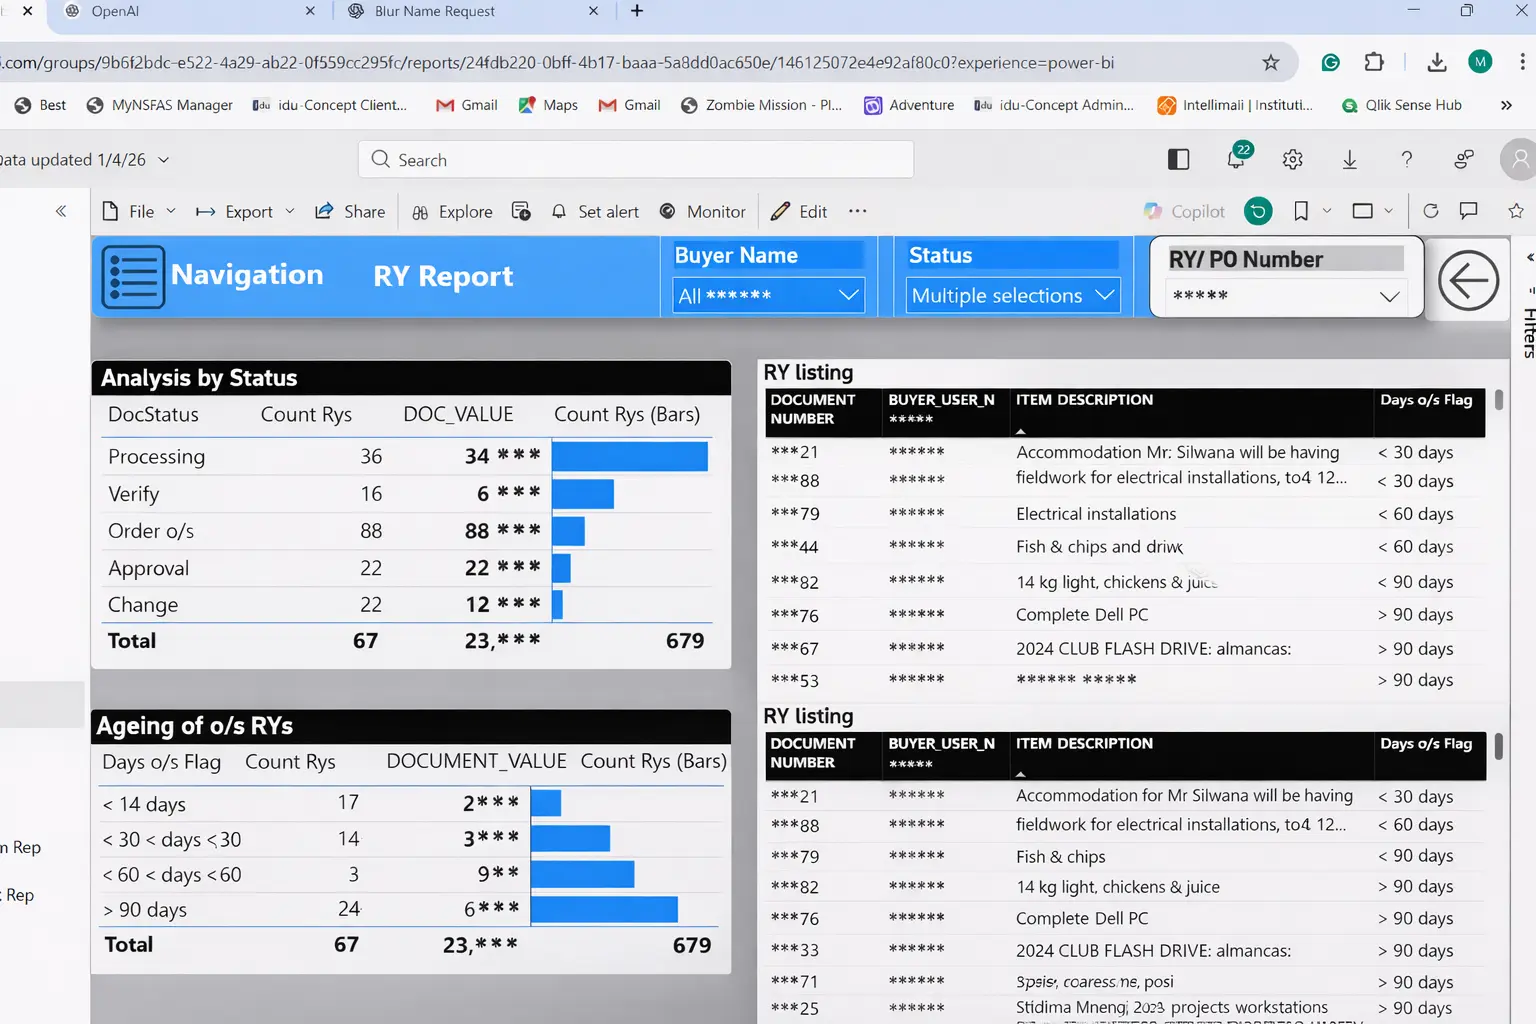
Commitments and creditors — period analysis
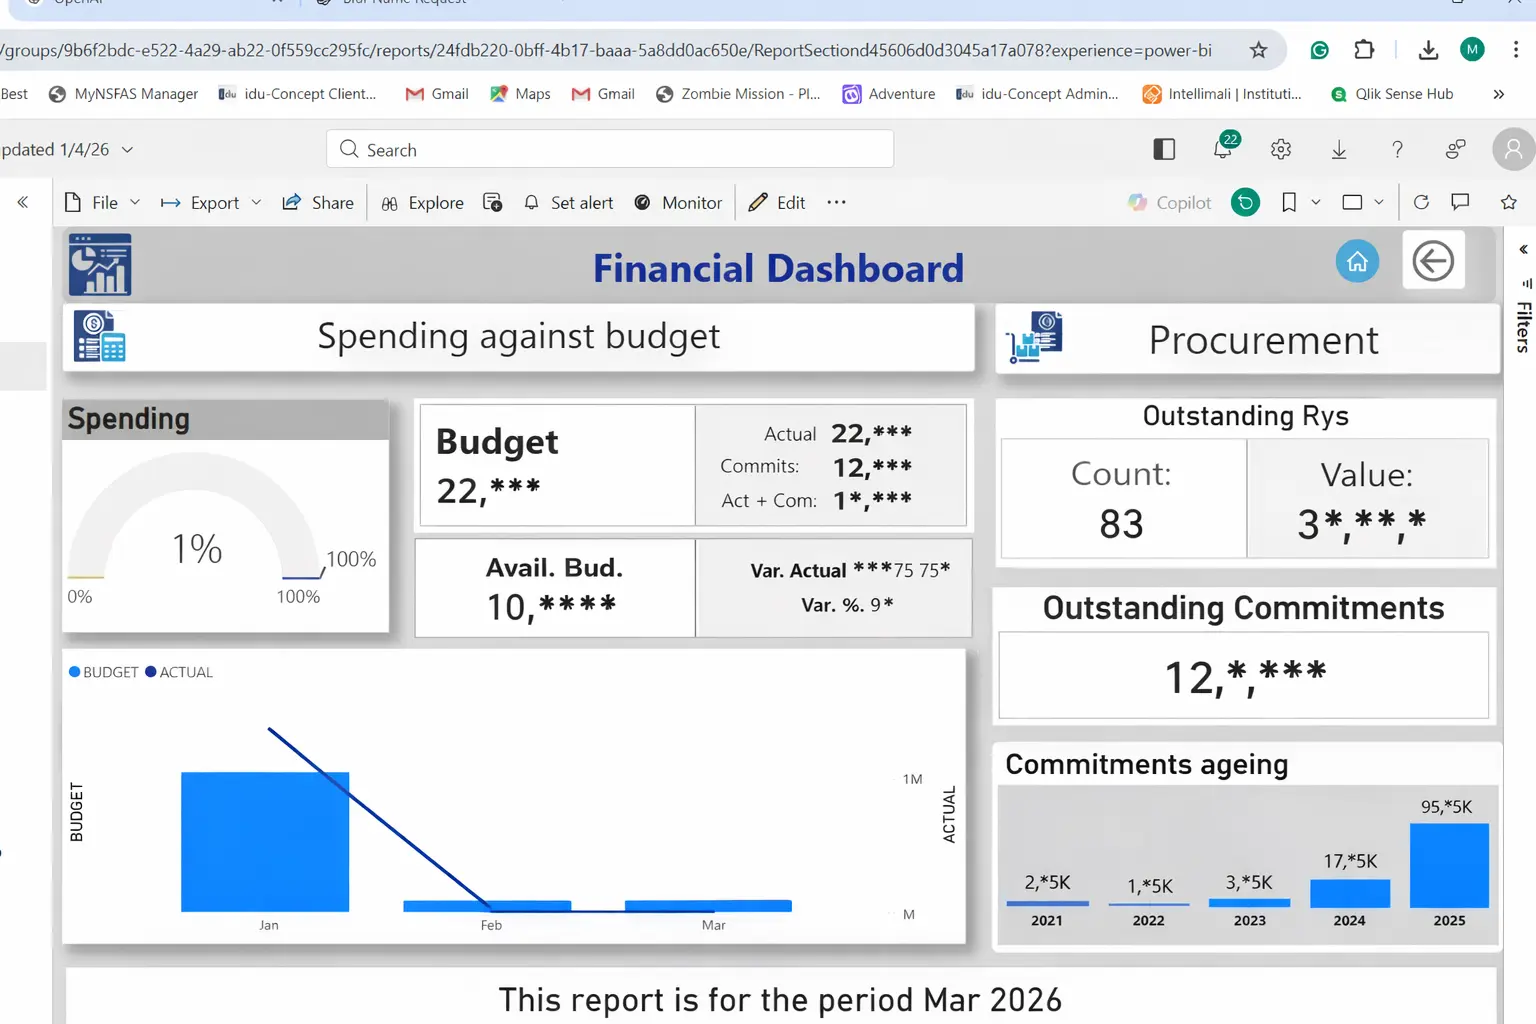
Financial performance dashboard
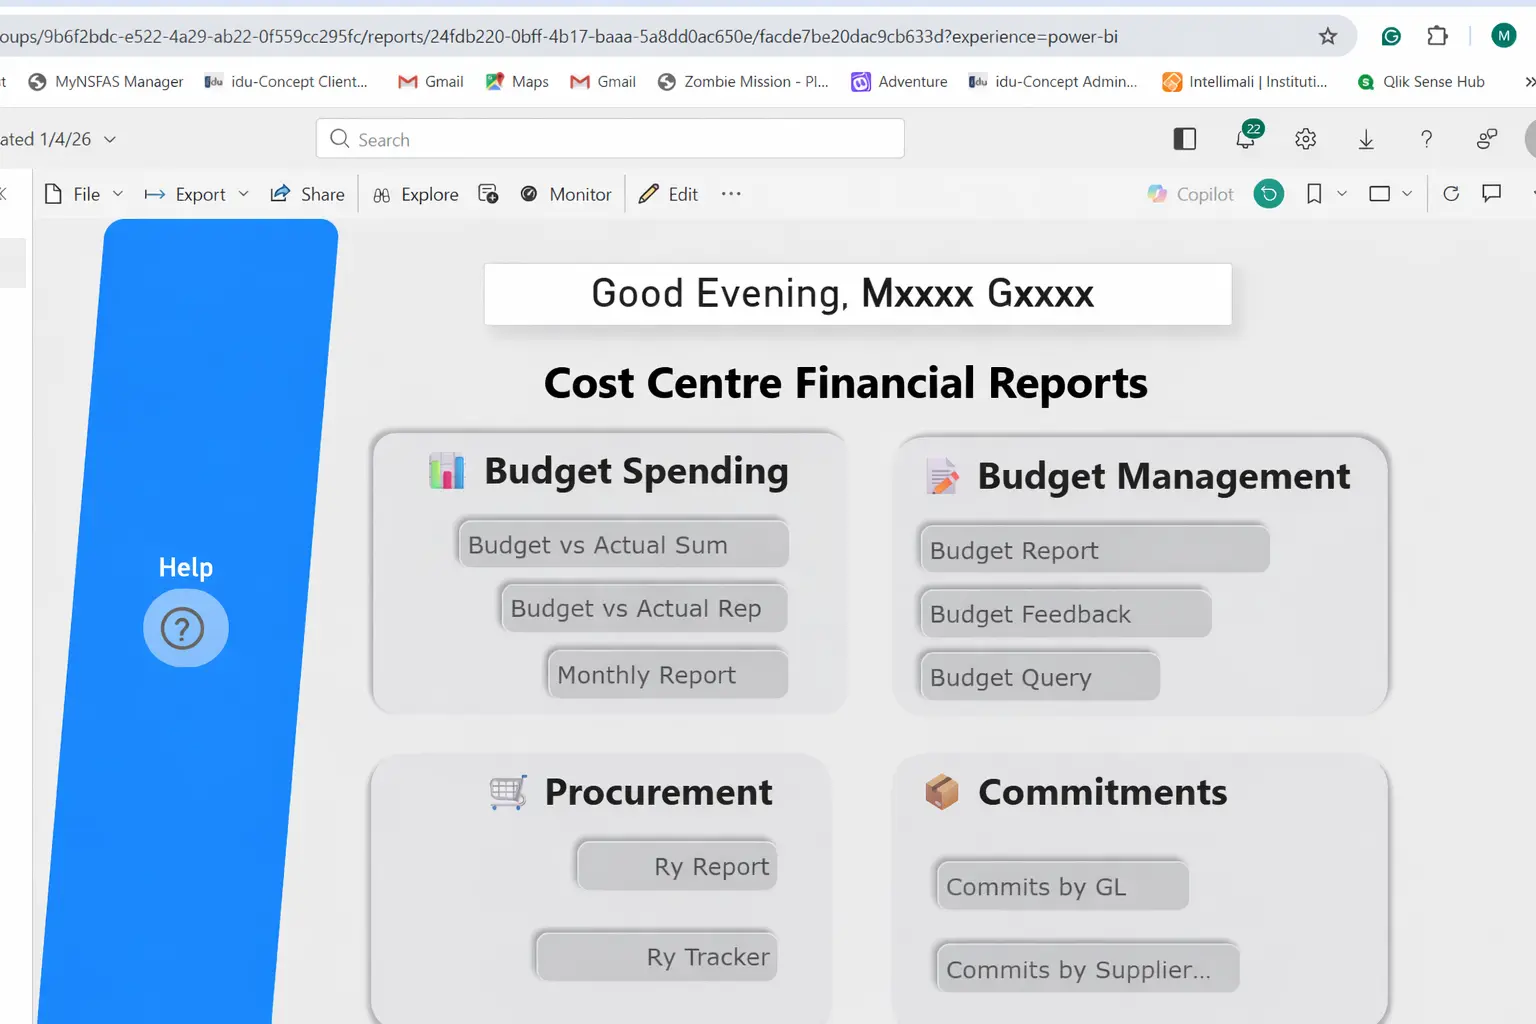
Cost centre financial reports
What This Means for Your Team
- Reduce reporting time from days to minutes
- Eliminate manual data consolidation and spreadsheet errors
- Improve confidence in your financial data
- Gain real-time visibility into performance
- Enable faster, more informed decision-making
Why Power BI for Finance Teams
- Automated and repeatable reporting
- Clear visibility into performance and trends
- Drill-down capability from summary to transaction level
- Integration with existing systems and data sources
How We Help
We design, build, and support Power BI solutions tailored to finance teams:
- End-to-end implementation and dashboard development
- Improvement and optimisation of existing reports
- Data modelling and DAX development
- Integration with ERP and other systems
- Data validation and reconciliation support
- Ongoing support and troubleshooting
Outcome: Reliable, trusted, and efficient reporting that supports decision-making.
The CMN Difference
We are finance professionals first.
This means we understand your reporting requirements, your challenges, and how finance teams actually work — allowing us to translate your needs into practical, effective BI solutions.
Our approach is structured and collaborative:
- Understand your requirements, processes, and reporting needs
- Build a working prototype to validate design and functionality
- Refine the solution through feedback and iteration
- Deliver a full-scale, production-ready solution
We integrate on-the-job training throughout all phases of the implementation — ensuring your team is fully equipped to use, maintain, and extend the solution over time.
Finance-First Power BI
Most Power BI solutions are built from a technical perspective.
CMN Consulting is led by a Chartered Accountant (CA(SA)) and CFO, ensuring:
- Reports align with real financial processes
- Data is accurate, reconciled, and trusted
- Insights support real business decision-making
We don't just build dashboards — we build decision support systems.
Typical Use Cases
- Management reporting
- Budget vs actual analysis
- Cost centre reporting
- Procurement dashboards
- Payroll and cost analysis
More reporting examples
These examples show budget vs actual summaries, multi-period trend reporting, and how reports can be structured for clarity and maintenance in a finance environment.
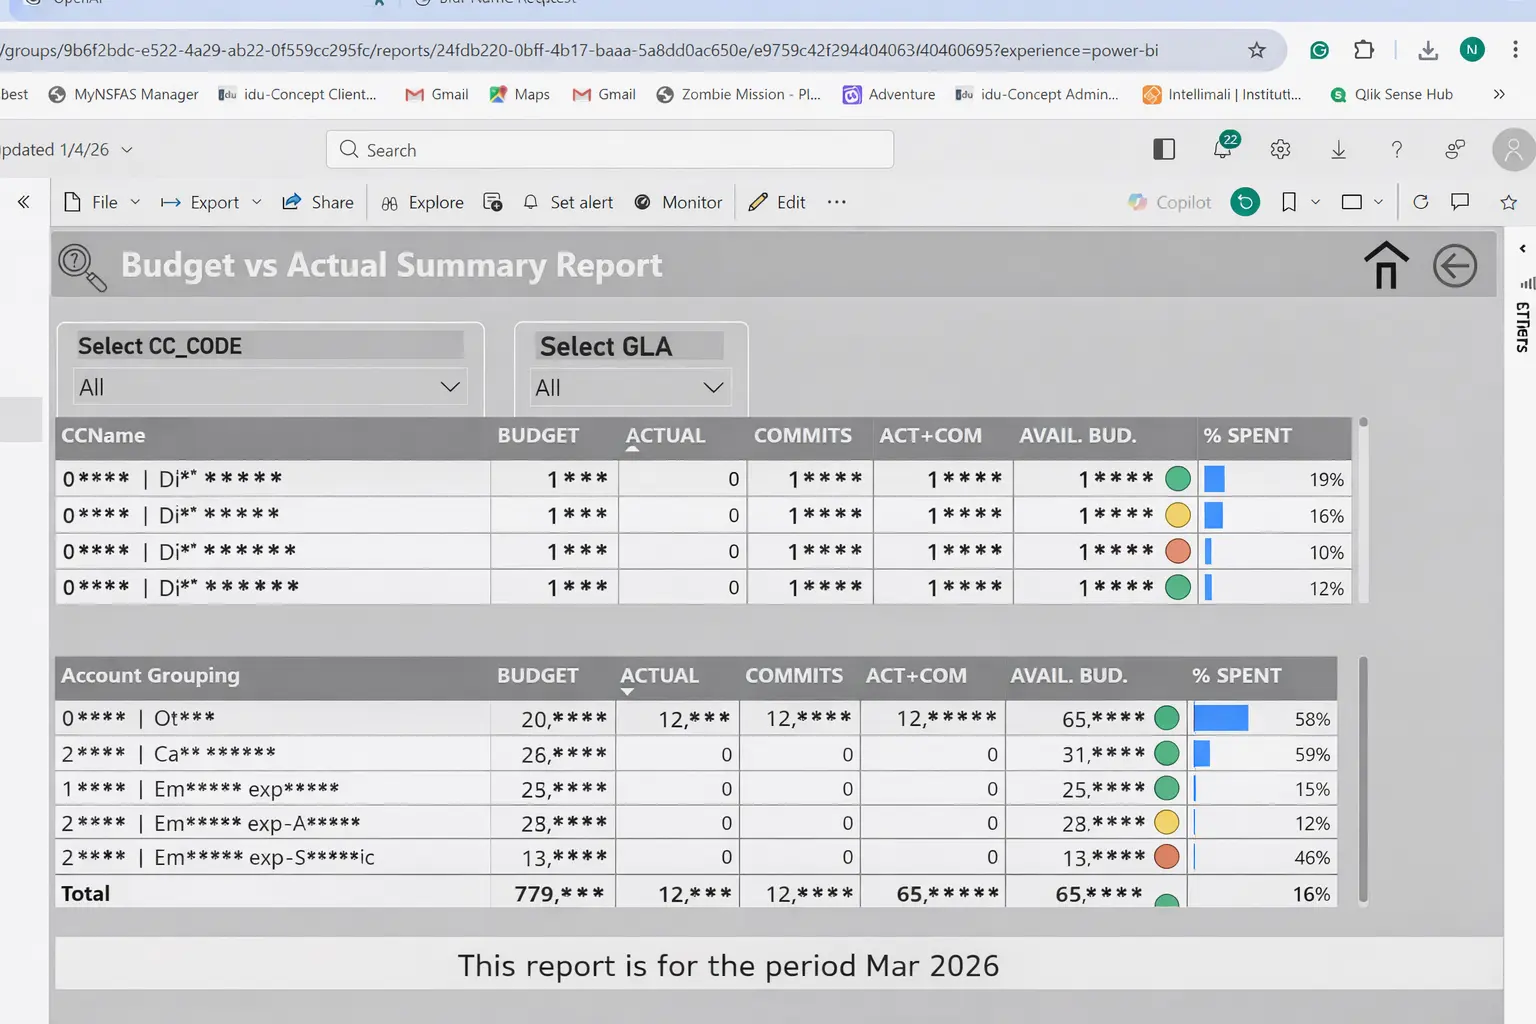
Budget vs actual — summary and variance
Trend reporting across periods
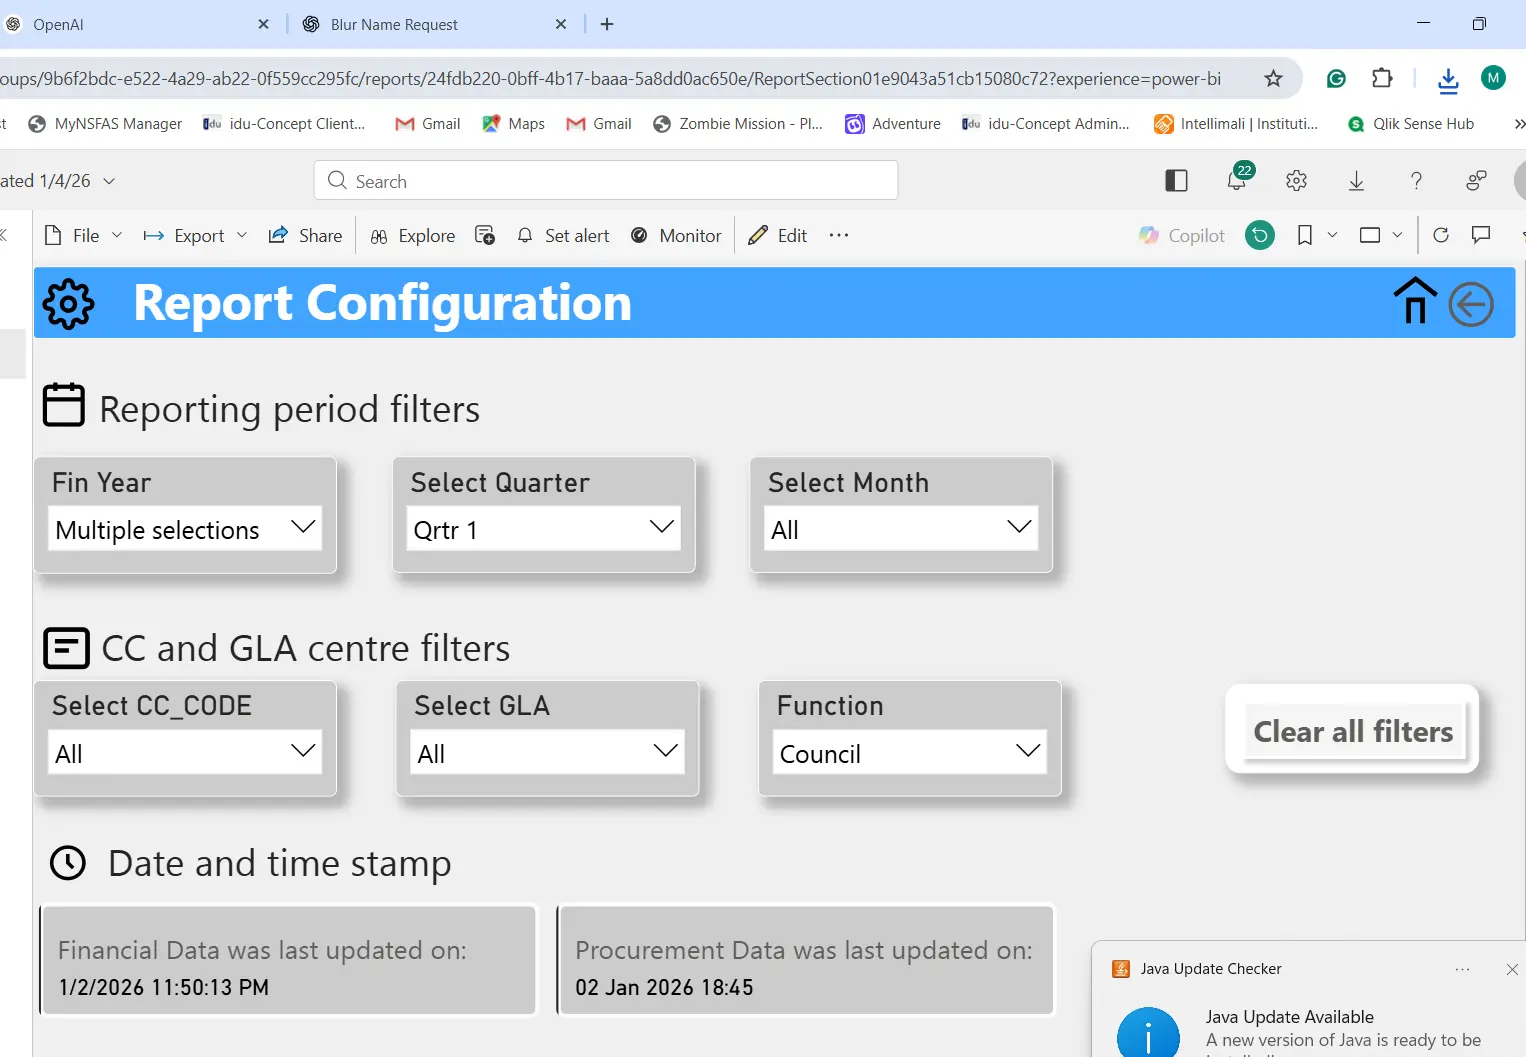
Report structure and navigation
Training
We provide hands-on training to ensure your team can confidently use and maintain Power BI solutions. See our Training page for details.